
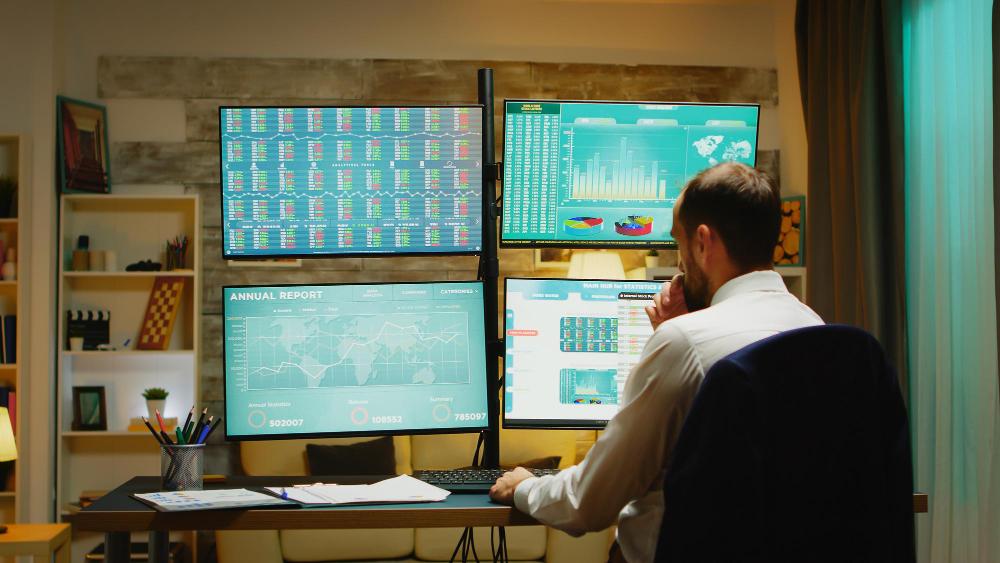
Let's be real, most traders analyze one stock at a time and call it a day, completely missing the bigger picture sitting right next to it. You can nail the technicals on a single ticker and still get blindsided because the entire sector it belongs to was quietly rotating out of favor the whole time. That's the blind spot proper industry comparative analysis is meant to fix, looking at how a stock behaves relative to its peers, its sector, and even adjacent industries instead of treating it like it exists in a vacuum. Truth is, a lot of "surprise" losses aren't surprises at all, they're just sector-wide moves nobody bothered checking for ahead of time.
The Trap of Tunnel Vision Trading
Tunnel vision is sneaky because it feels like diligence. You've read the earnings report, checked the chart, maybe skimmed an analyst note, and it feels thorough. But if you never step back and ask how this company's stacking up against five others in the same space, you're missing context that often matters more than the individual numbers themselves. I've seen traders get genuinely blindsided by a stock dropping on decent earnings, simply because the whole sector was repricing around a competitor's miss two days earlier. That's not bad luck, that's a research gap, plain and simple.
What Comparative Analysis Actually Reveals
Comparing companies side by side isn't just eyeballing a couple of stock charts stacked on top of each other, though a lot of people treat it that way. Real comparative work means lining up valuation multiples, earnings trends, options flow, and volatility behavior across an entire peer group to see who's actually leading and who's just riding momentum they didn't earn. It tells you whether a stock's move is company-specific or part of something bigger happening across the whole industry. That distinction changes how you should be trading it entirely, and honestly it's the difference between a calculated position and a guess dressed up nicely.
How OIAMR Approaches This Kind of Sector-Wide View
This is exactly the lane a platform like OIAMR sits in, pulling fundamental data, options activity, and predictive analytics together across multiple names at once instead of forcing you to manually pull up five separate charts and squint at them side by side. When you can see open interest shifts and volatility patterns across an entire sector in one dashboard, the picture gets a lot clearer, a lot faster. It's the kind of context that used to take institutional research teams days to compile, now sitting in front of retail traders who actually bother to use it.
Options Flow Tells a Sector Story Too
Here's something people underestimate, options flow isn't just noise about one stock, it's often an early signal about how the whole sector's being positioned. When you see unusual call buying stacking up across multiple names in the same industry, that's rarely a coincidence, it's usually smart money betting on a sector-wide catalyst before it's public knowledge. Good software for options trading should let you spot that kind of pattern across a peer group, not just flag activity on a single ticker in isolation. Missing that broader signal means missing half the story behind why a stock's suddenly moving.
Backtesting Comparative Strategies, Not Just Single Stocks
Most people backtest a strategy against one stock's history and assume that's good enough. It's not, not really. A pairs trade or a sector rotation strategy needs to be tested against how multiple companies actually moved relative to each other over time, not just how one ticker performed in isolation. Skipping this step means you're trusting a comparative strategy you never actually validated, and that gap tends to show up at the worst possible moment, usually right when real money's on the line.
Fundamentals Are the Backbone of Honest Comparisons
You can't do real comparative analysis without solid fundamental data underneath it, otherwise you're just comparing price charts, which is basically comparing shadows. Revenue growth, margins, debt loads, historical earnings surprises, all of this needs to sit side by side across a peer group for the comparison to actually mean something. A platform combining fundamental stock data with sector-wide options analytics, which is squarely what OIAMR offers, gives traders the fuller, more honest picture that a single-stock screener just can't replicate no matter how good its charts look.
Predictive Modeling Across a Whole Sector
Predictive analytics gets even more useful once you stop pointing it at one stock and start pointing it at an entire industry. Patterns that seem random in isolation often make a lot more sense once you see them echoed across three or four peer companies at once. It's not a guarantee, nothing in trading ever is, but it does stack the odds meaningfully in your favor when you can see a signal confirmed across multiple names instead of trusting a single data point that might just be noise.
Where This Leaves Traders Who Actually Adapt
Markets keep rewarding people who see the bigger picture and keep punishing the ones stuck staring at a single chart in isolation, that pattern isn't changing anytime soon. The short answer is, if you want research that actually holds up, you need infrastructure built for comparing across an industry, not just tracking one name in a vacuum and hoping nothing else matters. Platforms like OIAMR were built with exactly this gap in mind, and traders pairing solid software for options trading with genuine cross-sector awareness are the ones who consistently catch moves everyone else only explains after the fact.
 English
Join our community to interact with posts!